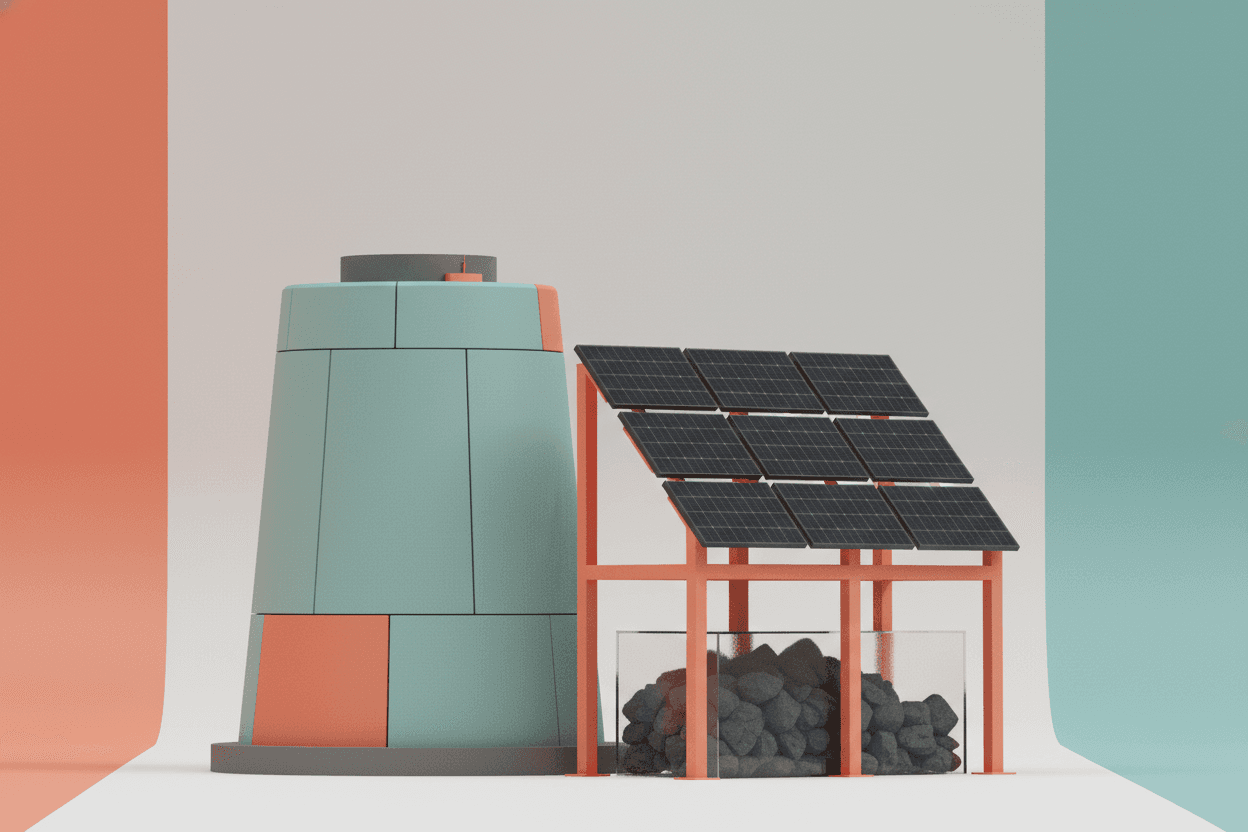
Solar panels made with coal power. Wind turbines needing 900 tons of concrete. The hidden carbon math that challenges everything you believe about clean energy.
Hyle Editorial·
Your solar panel was manufactured using coal-powered electricity in China. The wind turbine in your backyard required 900 tons of concrete. Nuclear's lifetime carbon footprint is lower than both.
In 2023, China manufactured over 80% of the world's solar panels, predominantly using electricity generated from coal-fired power plants. The silicon purification process alone demands temperatures exceeding 1,400°C, typically sustained by burning fossil fuels. Meanwhile, a single 5-megawatt offshore wind turbine requires a foundation containing nearly 900 tons of concrete—whose production accounts for approximately 8% of global CO2 emissions. These uncomfortable truths don't appear in marketing brochures for green energy.
Lifecycle Assessment (LCA) is the rigorous methodology scientists use to calculate total environmental impact—from raw material extraction through manufacturing, operation, and eventual decommissioning. Unlike tailpipe emissions, which only measure pollution during use, LCA reveals the full carbon accounting that energy advocates often prefer to ignore.
The International Energy Agency and IPCC have compiled comprehensive LCA data across all energy sources. The results challenge conventional wisdom about what constitutes "clean" energy. Measured in grams of CO2-equivalent per kilowatt-hour (gCO2eq/kWh), the numbers tell an unexpected story.
The Hidden Carbon in Solar Manufacturing
Solar photovoltaic technology appears emissions-free during operation. Sunlight hits silicon, electrons flow, no combustion occurs. But upstream processes tell a different story.
Polysilicon production requires massive energy inputs. To manufacture solar-grade silicon, quartz rock is heated in electric arc furnaces with carbon electrodes. In China's Xinjiang region—home to roughly 45% of global polysilicon supply—coal provides approximately 75% of electricity generation. A 2022 study in Nature Energy found that solar panels manufactured in coal-dependent regions have lifecycle emissions up to 40% higher than those made with cleaner electricity grids.
[!INSIGHT] The carbon intensity of solar manufacturing varies dramatically by production location. Panels made in Norway (98% hydropower) have lifecycle emissions around 6 gCO2eq/kWh, while identical panels from coal-dependent Chinese provinces can exceed 40 gCO2eq/kWh—approaching natural gas levels.
The industry also generates significant hazardous waste. Silicon tetrachloride, a toxic byproduct of polysilicon refining, requires careful handling and disposal. In rapid-growth markets, environmental regulations have sometimes lagged behind production expansion.
Wind Power's Concrete Problem
Wind energy advocates rarely mention that those elegant spinning blades sit atop massive reinforced concrete foundations. A standard 2.5 MW onshore turbine requires approximately 500 cubic meters of concrete—roughly 1,200 tons. Offshore installations demand even more substantial foundations, with some monopile designs exceeding 900 tons of concrete and steel.
Cement production alone contributes nearly 8% of global carbon emissions. Each ton of concrete releases approximately 100-150 kg of CO2 during manufacturing, primarily from calcining limestone (CaCO3 → CaO + CO2) and fueling kilns at 1,450°C.
“*"When we account for the concrete foundations, steel towers, and rare earth magnets in wind turbines, the embodied carbon is substantial. It's still lower than fossil fuels, but the gap narrows considerably compared to nuclear.”
— Dr. Mark Diesendorf, Energy Systems Researcher, University of New South Wales
Additionally, neodymium and dysprosium—rare earth elements essential for turbine generator magnets—often come from mining operations with significant environmental footprints. Bayan Obo in Inner Mongolia, source of much of the world's rare earth supply, has created a radioactive tailings lake visible from satellite imagery.
The Battery Storage Multiplier
Renewables require energy storage to compensate for intermittency. Lithium-ion batteries add another layer of carbon intensity to the clean energy equation.
Lithium extraction, whether from hard-rock mining in Australia or brine evaporation in Chile's Atacama Desert, consumes substantial water and energy. Cobalt—still used in many battery chemistries—frequently originates from the Democratic Republic of Congo, where mining practices raise both environmental and human rights concerns.
A 2021 study in Joule calculated that grid-scale battery storage adds 30-80 gCO2eq/kWh to renewable energy systems, depending on storage duration and battery chemistry. When you factor in that wind and solar produce electricity only 20-40% of the time (capacity factor), requiring significant overbuilding and storage, the carbon math becomes even less favorable.
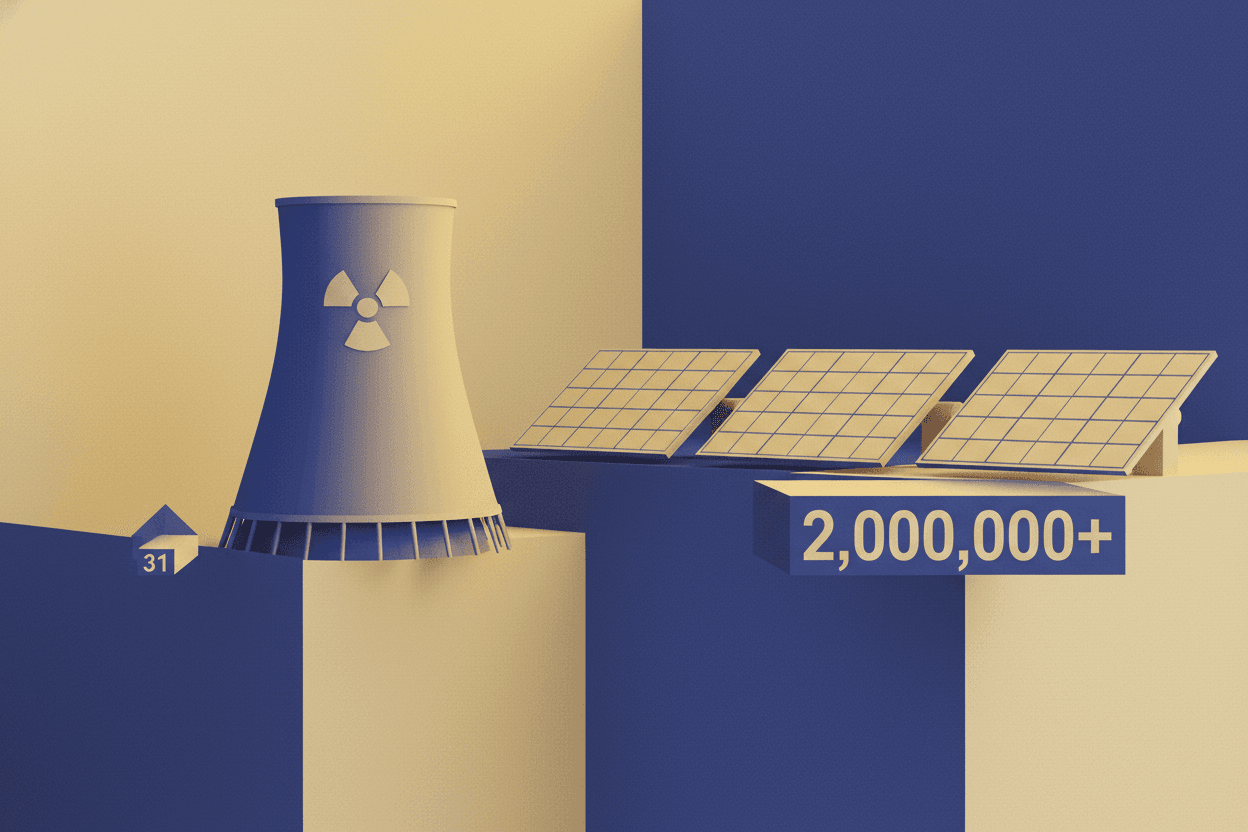
Nuclear's Surprising Carbon Advantage
Nuclear power plants are enormously expensive and take years to construct. But from a pure carbon perspective, they outperform nearly every alternative.
The IPCC's Fifth Assessment Report synthesized 125 lifecycle studies and found nuclear's median emissions at 12 gCO2eq/kWh—comparable to wind (11-12 gCO2eq/kWh) and significantly lower than utility-scale solar (41 gCO2eq/kWh median across all studies).
Why Nuclear's LCA Is So Low
Several factors explain nuclear's carbon efficiency:
Energy Density: A single uranium fuel pellet (roughly the size of a fingertip) contains as much energy as one ton of coal or 149 gallons of oil. This extreme density means minimal physical material extraction per unit of electricity generated.
Long Operational Lifespan: Nuclear plants operate for 60-80 years with minimal fuel replacement. The initial carbon investment in concrete and steel is amortized over decades of near-zero-emission operation.
High Capacity Factor: Nuclear plants run at 90%+ capacity factors, generating consistent baseload power. A 1 GW nuclear plant produces approximately 8,760 GWh annually—versus roughly 3,500 GWh from a 1 GW solar array in a favorable location.
[!INSIGHT] When you normalize carbon emissions by actual electricity delivered rather than nameplate capacity, nuclear's advantage grows substantially. A 1 GW nuclear plant operating at 92% capacity factor over 60 years produces 483,000 GWh of low-carbon electricity. Achieving equivalent output from solar (25% capacity factor, 30-year lifespan) would require building and rebuilding approximately 18 GW of solar capacity.
The Mining Comparison
Critics often highlight uranium mining's environmental impact. Yet by volume, uranium mining is orders of magnitude smaller than coal mining or the material requirements for renewables.
A 1 GW nuclear plant requires approximately 200 tons of uranium fuel annually. A 1 GW coal plant burns roughly 3 million tons of coal per year. For solar, generating 1 TWh of electricity over 30 years requires mining approximately 14,000 tons of materials—versus roughly 400 tons for nuclear to produce the same output.
Implications for Climate Policy
The central insight from LCA analysis is that "renewable" does not automatically mean "low-carbon." Manufacturing location, material sourcing, operational lifespan, and capacity factor all significantly impact real-world emissions.
[!NOTE] Current energy subsidies and tax incentives often reward deployment rather than actual carbon displacement. A solar panel manufactured with coal electricity receives the same tax credit as one made with clean power, despite dramatically different lifecycle emissions. Carbon border adjustments and embodied carbon accounting could transform these economic calculations.
Germany's Energiewende illustrates the tradeoffs. Between 2010-2020, Germany invested over €500 billion in renewable energy deployment. Yet in 2022, following nuclear plant closures, German electricity emissions rose as coal generation filled the gap. The country's per-capita electricity carbon intensity remains among the highest in Europe.
Conversely, France—which generates approximately 70% of electricity from nuclear—maintains one of the lowest-carbon electricity grids among major industrial economies. French per-capita power sector emissions are roughly one-fifth of Germany's.
Conclusion
The climate crisis demands rigorous honesty about energy tradeoffs. Renewables play a crucial role in decarbonization, but they are not environmental free lunches. Manufacturing emissions, material extraction impacts, storage requirements, and capacity factors all matter.
Nuclear energy—despite its genuine challenges of cost, waste, and proliferation risk—offers among the lowest lifecycle carbon footprints of any electricity source. The data suggests that excluding nuclear from clean energy portfolios makes decarbonization harder, slower, and potentially more carbon-intensive.
Key Takeaway: Lifecycle analysis reveals that nuclear power's carbon footprint (12 gCO2eq/kWh) equals or beats wind and significantly outperforms solar when accounting for manufacturing, materials, and capacity factors. The "clean" in clean energy refers to operation, not the full supply chain—and that distinction should reshape climate policy.
Sources: IPCC Fifth Assessment Report, Working Group III; International Energy Agency World Energy Outlook 2023; UNECE Life Cycle Assessment of Electricity Generation Options (2021); Nature Energy, "Carbon Footprint of Global Solar Photovoltaic Supply Chains" (2022); Joule, "The Carbon Footprint of Grid-Scale Battery Storage" (2021); World Nuclear Association.
This is a Premium Article
Hylē Media members get unlimited access to all premium content. Sign up free — no credit card required.